Its probability density function is defined as follows:
(1) 
import numpy as np
import matplotlib.pyplot as plt
from scipy.stats import multivariate_normal
from mpl_toolkits.mplot3d import Axes3D
#Parameters to set
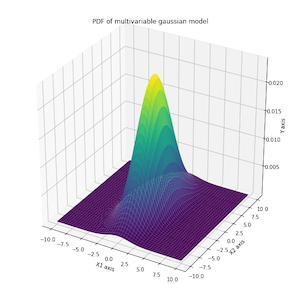
mu_x = 0
variance_x = 3
mu_y = 0
variance_y = 15
#Create grid and multivariate normal
x = np.linspace(-10, 10, 500)
y = np.linspace(-10, 10, 500)
X, Y = np.meshgrid(x,y)
pos = np.empty(X.shape + (2,))
pos[:, :, 0] = X; pos[:, :, 1] = Y
rv = multivariate_normal([mu_x, mu_y], [[variance_x, 0],
[0, variance_y]])
#Make a 3D plot
fig = plt.figure(figsize=(10, 10))
ax = fig.gca(projection='3d')
ax.plot_surface(X, Y, rv.pdf(pos),cmap='viridis',linewidth=0)
ax.set_xlabel('X1 axis')
ax.set_ylabel('X2 axis')
ax.set_zlabel('Y axis')
plt.title('PDF of multivariable gaussian model')
plt.show()